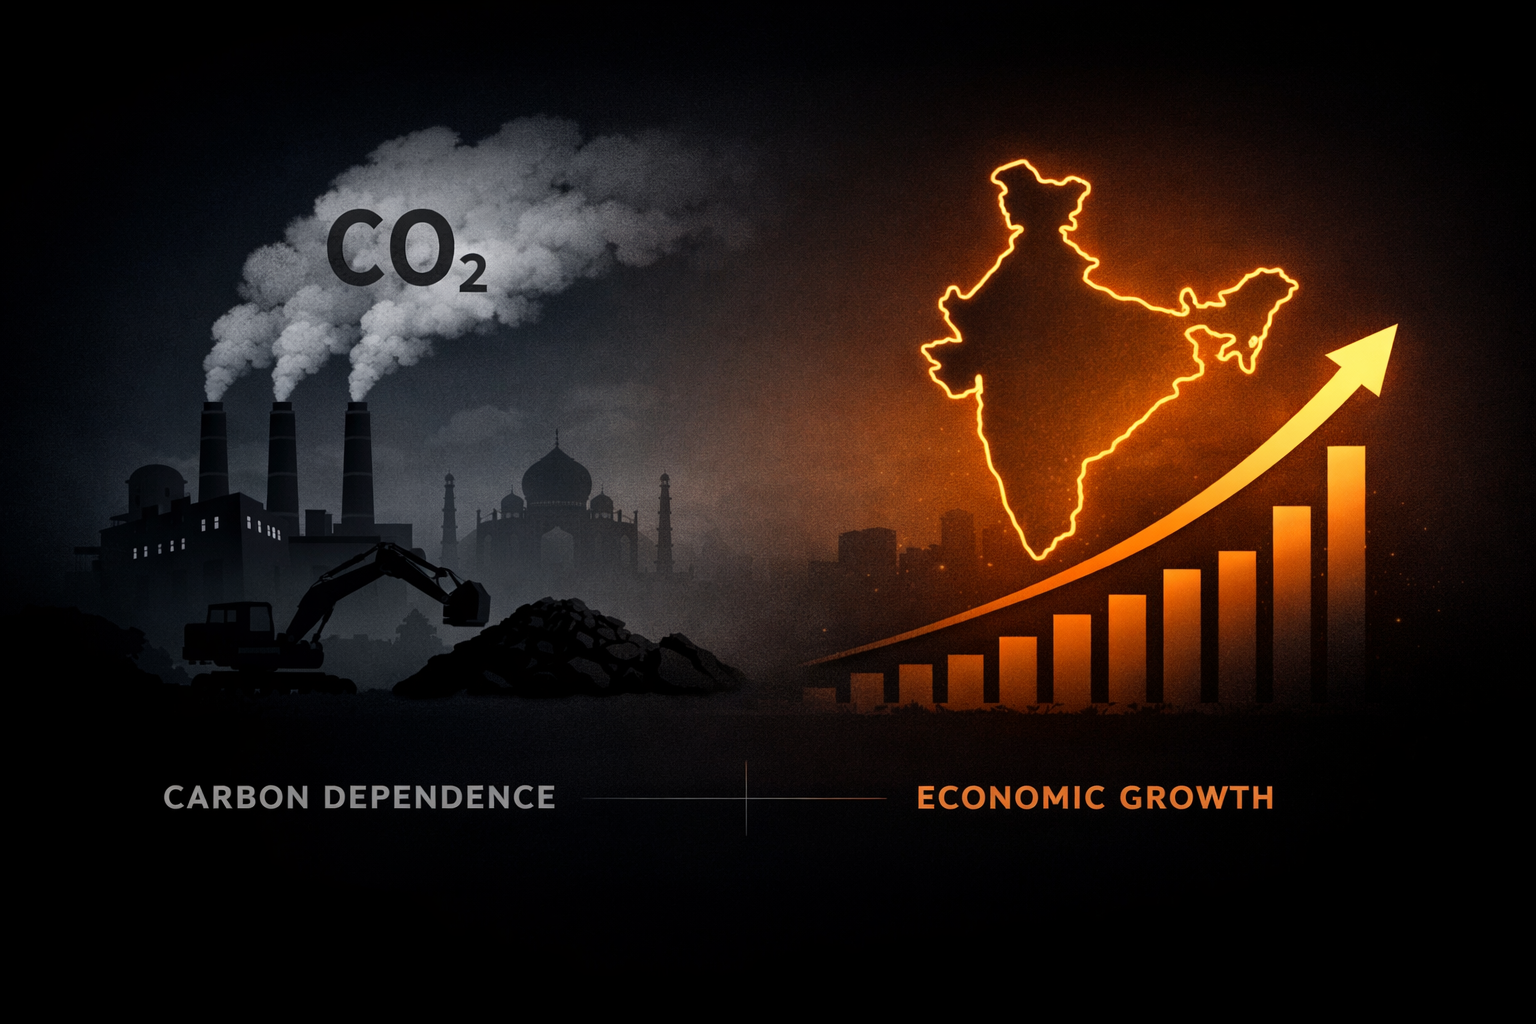
India just crossed 1 billion tonnes of coal production while simultaneously leading one of the world’s fastest renewable expansions , raising a critical question:
Is the country’s economic growth still structurally tied to fossil energy?

India’s Current Energy & Growth Landscape
India’s economic expansion is unfolding alongside a dramatic surge in energy demand. In FY2024–25, India crossed 1 billion tonnes of coal production, reaching roughly 1,047 million tonnes, the highest level in its history, according to data from the Ministry of Coal and Government of India (Ministry of Coal, 2025). Coal continues to dominate India’s energy system, accounting for around 55% of total primary energy consumption and roughly 70–74% of electricity generation, based on estimates from the International Energy Agency (IEA) and India’s Central Electricity Authority (CEA) (IEA, 2023; CEA, 2024). At the same time, electricity demand has been rising rapidly due to urbanization, expanding manufacturing capacity, digital infrastructure growth, and increasingly frequent heat-driven peak loads. Government projections suggest that India’s electricity demand could double by 2040, making energy security a central pillar of economic policy (IEA, India Energy Outlook, 2021).
While India has simultaneously accelerate/d its clean energy transition, installing over 180 GW of renewable energy capacity and committing to 500 GW of non-fossil power capacity by 2030 under its climate targets the near-term reality remains clear: economic growth continues to rely heavily on fossil-based energy systems (Ministry of New and Renewable Energy, 2024; Government of India, Nationally Determined Contributions)
What the Data Reveals: Energy and Economic Growth
To explore this question, I analyzed India’s energy–growth relationship from 1990–2024 using a macroeconomic time-series framework linking three key variables: GDP per capita, capital formation (Gross Fixed Capital Formation), and energy intensity. The analysis uses the Quality of Government Standard Time-Series (QoG STS) dataset, which compiles macroeconomic and institutional indicators from sources such as the World Bank, IEA, and Penn World Tables (Teorell et al., 2024).

The results show strong evidence of a long-run equilibrium relationship among these variables, suggesting that energy use remains deeply embedded in the structure of economic growth. The impulse response results (shown in the graph below) illustrate how a shock in energy intensity affects GDP over time. When energy intensity rises—meaning more energy is used per unit of output—the response of GDP becomes negative and remains below baseline for several periods. In simpler terms, inefficient energy use appears to slow economic performance, indicating that improvements in energy productivity could play a critical role in sustaining long-term growth. This finding aligns with a large body of literature on the energy–growth nexus, which argues that energy is not merely an input but a structural driver of macroeconomic activity (Stern, 2011; IEA, 2023).

The forecast error variance decomposition (FEVD) results further highlight this relationship. Over time, fluctuations in GDP are increasingly explained not only by its own momentum but also by changes in energy intensity and capital formation. In the charts above, the growing contribution of energy variables to GDP variation suggests that energy efficiency and capital investment remain central drivers of economic dynamics. Put simply, the broader macroeconomy appears to be structurally linked to energy availability and efficiency, which is consistent with the concept of biophysical constraints on economic growth, where economic output ultimately depends on the energy systems that power production, infrastructure, and industrial activity (Ayres & Warr, 2009).
The Big Why: What About India’s Industrial Sector?

Looking ahead, the policy implications are significant. India has already taken several steps to reduce carbon dependence through major initiatives such as the Jawaharlal Nehru National Solar Mission, the National Green Hydrogen Mission, and large-scale renewable expansion. The country has installed over 180 GW of renewable capacity and aims to reach 500 GW of non-fossil electricity capacity by 2030, a key commitment under its updated climate targets (Ministry of New and Renewable Energy, 2024; Government of India NDC, 2022). Energy efficiency policies like the Perform, Achieve and Trade (PAT) scheme, implemented by the Bureau of Energy Efficiency, have also targeted energy reductions in heavy industries such as steel, cement, aluminum, and fertilizers (BEE, 2023).
Despite these efforts, coal remains the backbone of India’s power system. Coal still generates around 70–74% of India’s electricity, and in FY2024–25 coal production crossed 1 billion tonnes, reaching roughly 1,047 million tonnes, the highest level in the country’s history (Central Electricity Authority, 2024; Ministry of Coal, 2025). This reliance is particularly strong in energy-intensive industrial sectors like steel, cement, and chemicals, which account for a large share of industrial energy use (International Energy Agency, 2023). As India expands manufacturing through initiatives such as Make in India and Production Linked Incentive (PLI) schemes, industrial growth will inevitably raise energy demand. The key question is whether this expansion will deepen fossil dependence or whether technological change, electrification, and renewable integration can enable a cleaner growth pathway.
This leads to the central question for the next discussion: is India’s formal industrial sector beginning to decouple from fossil energy, or does it remain just as carbon-intensive as the broader economy? As India pushes to become a global manufacturing hub, where will the energy powering that expansion come from? The next analysis shifts from the aggregate economy to the industrial core of India’s growth model to explore this question.
Technical Appendix
This analysis examines the relationship between economic growth, capital formation, and energy intensity in India from 1990–2024 using a macroeconomic time-series framework. The primary data source is the Quality of Government Standard Time-Series Dataset (QoG STS), which compiles harmonized indicators from multiple international databases. Key variables include real GDP per capita, gross fixed capital formation, and energy intensity.
To identify long-run relationships, the study applies a Vector Error Correction Model (VECM) after testing for stationarity and cointegration using Augmented Dickey–Fuller (ADF) and Johansen cointegration tests. This framework captures both long-run equilibrium dynamics and short-run adjustments in the energy–growth nexus. System dynamics are further analyzed using Impulse Response Functions (IRF) and Forecast Error Variance Decomposition (FEVD) to examine how shocks to energy intensity affect economic output over time.
Replication files, R scripts, and model outputs are available here:
GitHub:
https://github.com/anshumanpatnaikgit/The-Dual-Metabolism-of-India-Macro-Lock-in-vs.-Industrial-Decoupling
References
Bureau of Energy Efficiency (BEE). (2023). Perform, Achieve and Trade (PAT) Scheme Reports. Government of India.
Central Electricity Authority (CEA). (2024). Power Sector Generation Statistics. Government of India.
Government of India. (2022). India’s Updated Nationally Determined Contributions (NDC).
International Energy Agency (IEA). (2023). India Energy Policy Review.
Ministry of Coal. (2025). Coal Production Statistics. Government of India.
Ministry of New and Renewable Energy (MNRE). (2024). Renewable Energy Capacity Reports. Government of India.
Teorell, J. et al. (2024). Quality of Government Standard Dataset (QoG STS). University of Gothenburg.
Johansen, S. (1991). Cointegration in VAR models. Econometrica, 59(6).
Stern, D. I. (2011). Energy and economic growth. Annals of the New York Academy of Sciences.
Leave a Reply