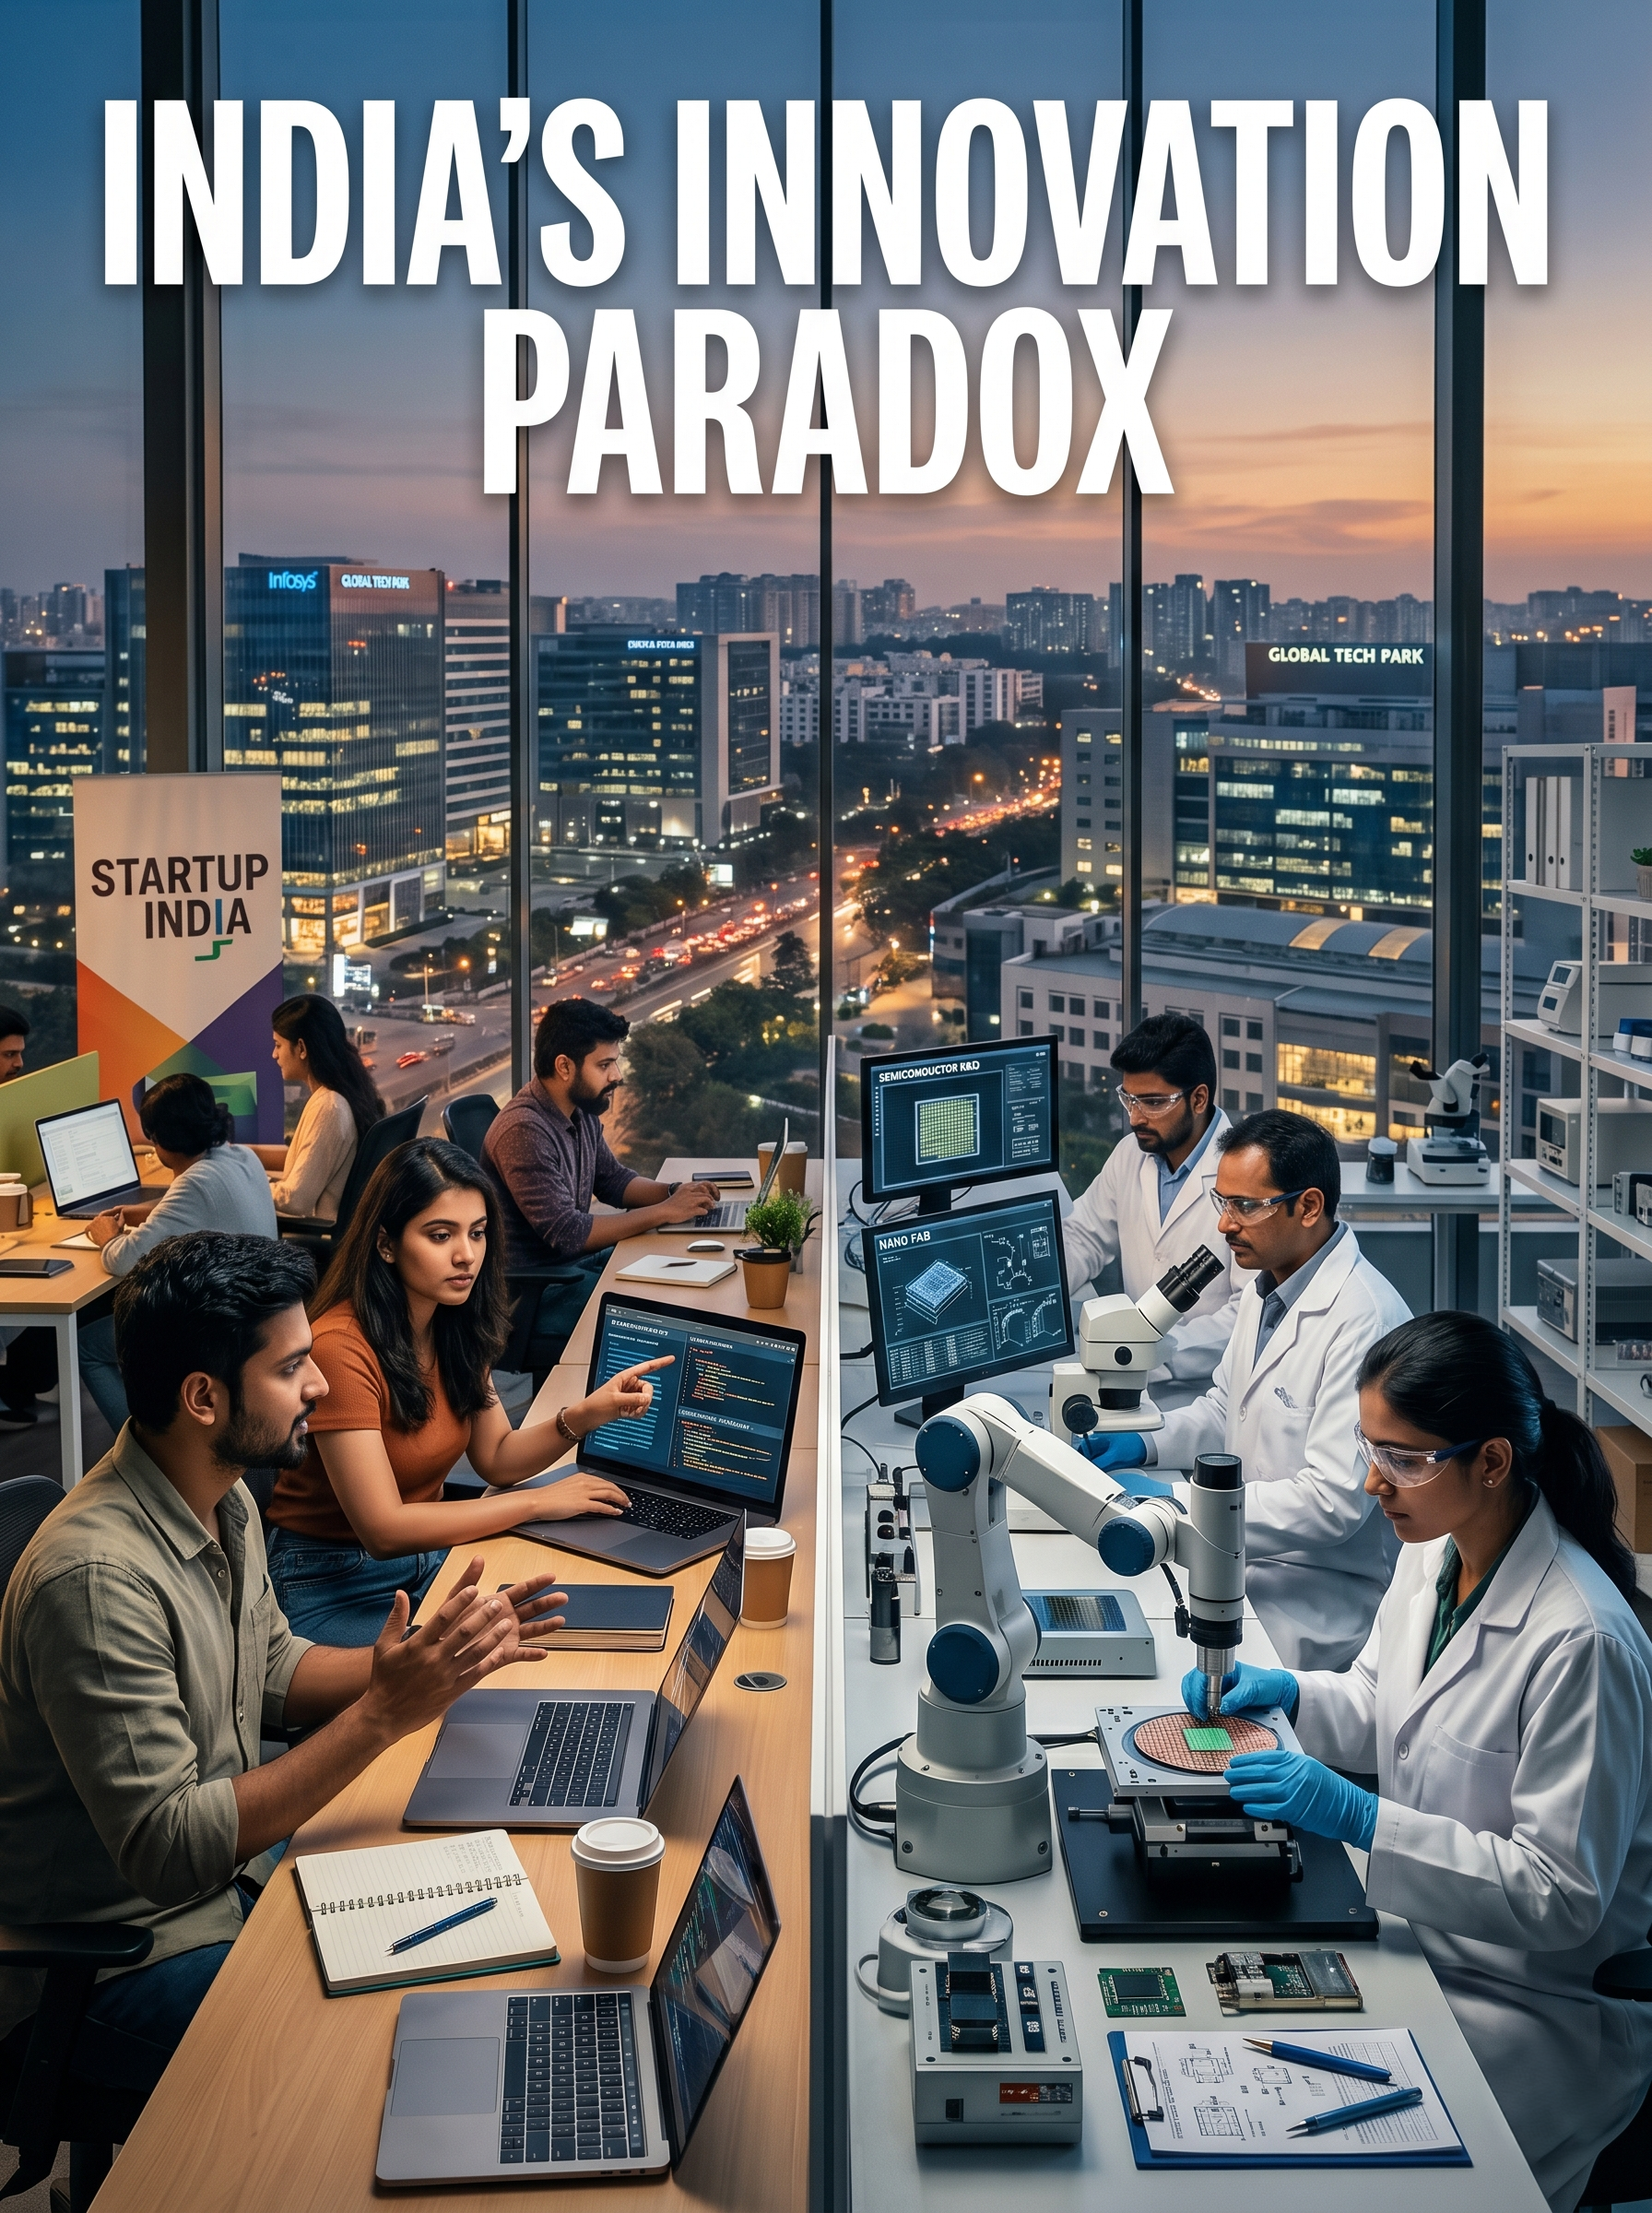
India’s Innovation Paradox
Inside the rise of a startup economy still building its research foundations
India has 100,000 recognised startups, nearly 100 unicorns, and a venture ecosystem that rivals most advanced economies. It also has an R&D intensity of 0.65 percent of GDP a number that has not meaningfully changed in twenty years. These two facts are not in tension. They are, as this essay argues, the same structural fact described from two different angles.
There is a particular kind of innovation ecosystem that emerges when a large economy has an abundance of software engineers, a digital consumer market of hundreds of millions of people, and a venture capital community that has learned to deploy capital efficiently at scale. It is fast, it is dynamic, and it produces a great many companies that look, from the outside, like the products of a healthy innovation economy. It is also, in a structural sense, extremely reluctant to do research.
India has built exactly this kind of ecosystem, with exceptional speed and genuine sophistication. The 43 position improvement in the Global Innovation Index since 2015 from 81st to 38th is the kind of data point that gets cited in ministerial speeches, and rightly so: almost no major economy has moved that far that fast on a composite measure of innovative capacity. The DPIIT’s 100,000 startup count represents a real achievement in institutional architecture in startup registration, in incubator policy, in early-stage capital formation. And yet the number that matters most for long-run economic competitiveness, the Gross Expenditure on Research and Development as a share of GDP, has barely moved in two decades. It was 0.75 percent in 2000. It was 0.65 percent in 2022.
To understand why these two trajectories coexist accelerating startup formation and stagnant research intensity requires going deeper than policy failure. It requires asking why a rational entrepreneur, a rational venture capitalist, and a rational large corporation in India’s current economic environment would each, separately, conclude that research is someone else’s problem.
Why Software Ecosystems Emerge Faster Than Research Ecosystems
and Why That Gap Persists
The fastest growing sectors of India’s startup economy fintech, quick commerce, SaaS, edtech, health aggregators share a structural characteristic that is worth dwelling on. They are all built on top of technology that was invented somewhere else. The cloud infrastructure is Amazon’s or Google’s. The machine learning frameworks are open-source, maintained primarily by engineers in California and Seattle. The semiconductor in the smartphone is TSMC’s or Samsung’s. The payment rails are UPI a genuine Indian infrastructure innovation but UPI itself runs on internet and mobile stack protocols designed in laboratories and companies outside India.
None of this is an indictment. Technology adoption is how most industrialisation works at India’s income level, and there is real ingenuity in building a payments company or a logistics platform on top of existing technological infrastructure the same way there was real ingenuity in building Ford’s assembly line on top of steel and engines that Ford did not invent. The distinction that matters is between the ingenuity of application and the ingenuity of discovery. India’s startup economy has become very good at the former. The latter the act of expanding the technological frontier rather than deploying it requires a different kind of institution, a different funding structure, and a very different tolerance for time.
Consider the economics of a quick-commerce startup against the economics of a semiconductor company. The former can reach a million active users inside twelve months, generate data on consumer behaviour that has immediate commercial value, and attract follow on capital based on retention metrics that a fund can evaluate within a standard two year portfolio review cycle. The latter might spend a decade and several hundred million dollars before a chip is commercially ready and that assumes the research problems get solved at all. The venture capital industry, which has been the primary architect of India’s startup ecosystem, is structurally calibrated for the former. Its fund cycles typically seven to ten years are barely adequate for deep-tech development timelines, and Indian VC funds have historically operated on even shorter effective horizons.
This is not a criticism of Indian venture capital it is a description of a rational market response to the available opportunity set. When UPI processes 15 billion transactions a month and 800 million people have smartphones, the arbitrage opportunities in consumer facing software are enormous and fast-cycling. The capital will flow there. In Israel, where military R&D through Unit 8200 and Talpiot has spent decades producing engineers who have solved hard problems in cryptography, surveillance, and communications systems, the natural startup formation is different: cybersecurity companies like Check Point and CyberArk, agricultural precision technology, autonomous systems, medical devices. The research happened first, at scale, funded by the state, and the venture ecosystem commercialised it. In India, the sequence has been largely inverted the venture ecosystem arrived before the research depth, and has shaped the startup culture accordingly.
The 36 Percent Problem
In most economies that have successfully built high research intensity innovation systems, the decisive shift came not from government spending but from private sector investment in knowledge creation. Israel’s private sector accounts for approximately 92 percent of total R&D spending. South Korea’s, roughly 79 percent. China’s, around 77 percent a transformation that took about twenty deliberate, policy driven years from a base not unlike India’s current position. In India, the private sector contributes approximately 36 percent of GERD, according to the Ministry of Science and Technology’s 2024 parliamentary data citing DST figures. Government and higher education together account for the rest.
The composition of that 36 percent is itself revealing. Pharmaceuticals dominate, accounting for roughly a third of all private sector research spending, according to DST’s sectoral breakdown. This reflects the Indian generics industry’s genuine research capability but that capability is oriented toward process chemistry, toward replicating known molecules more efficiently, not toward discovering novel therapeutic mechanisms. It is research, but it is research aimed at the near frontier rather than beyond it. The information technology sector, despite employing more engineers than almost any country on Earth, contributes only about 10 percent of private R&D spending. The explanation for this number is both simple and structural: most of India’s IT industry is a services industry, not a products industry. It does not, in the aggregate, need to own intellectual property it needs to deploy other people’s intellectual property more efficiently and at lower cost.
The reason private sector R&D remains low is not mysterious: most of India’s large private firms are not in industries that require frontier research to compete. Reliance is an energy, retail, and telecoms conglomerate. TCS and Infosys are IT services businesses whose competitive advantage is in talent arbitrage and operational efficiency, not proprietary technology. HDFC and ICICI compete on financial relationships and distribution, not algorithmic discovery. These are not bad businesses several of them are exceptional ones but they are not research intensive businesses, and their continued dominance of India’s private sector means the aggregate private R&D share stays low even as the economy grows.
The structure of an economy’s largest firms shapes its research intensity as much as any policy. India’s dominant private enterprises were built for a pre-research competitive environment. Changing the aggregate requires changing the competitive incentives which is a slower and harder problem than any budget line.
The private sector research problem in structural termsOne Hundred Thousand Startups, and What Most of Them Are Making
The DPIIT’s 100,000 startup count covers an enormous range of companies, and caution is warranted about what it means. Many are small, many are early stage, and a significant proportion are in sectors retail, food delivery, education, healthcare administration where “startup” describes the business structure more than the underlying innovation type. India’s most celebrated startup successes Zepto and Blinkit in quick commerce, Razorpay and PhonePe in payments, Freshworks and Zoho in SaaS are genuinely impressive businesses. They are also, with some exceptions, businesses built on technology platforms and infrastructure developed primarily elsewhere.
The sector composition of the DPIIT ecosystem is instructive. IT and SaaS together account for roughly 28 percent of all recognised startups, according to NASSCOM’s 2023 analysis. Fintech adds another nine percent. Healthcare, edtech, and e-commerce together contribute further. Deep-tech semiconductors, advanced materials, quantum, synthetic biology, defence systems represents a small single-digit fraction by count, and a similarly modest fraction by capital deployed. This is not a criticism of what Indian entrepreneurs have chosen to build; it is a description of what the incentive structure of India’s innovation ecosystem makes rational. When the fastest route to a $100 million valuation runs through a consumer app rather than a research laboratory, the market is providing a very clear signal about where effort should go.
The contrast with other ecosystems that have successfully incubated deep-tech at scale is sharp. Y Combinator’s portfolio, which set the template for accelerator culture globally, includes companies across semiconductors, biotech, nuclear energy, and space sectors that require technical risk taking of a fundamentally different kind than a SaaS platform. Station F in Paris, the world’s largest startup campus by floor space, has deliberately cultivated deep-tech within a French industrial policy framework that provides long-horizon public R&D funding alongside venture capital. The Tsinghua University Zhongguancun ecosystem in Beijing is built around a research university with genuine scientific output, so that technology transfer from laboratory to company is a designed feature of the system rather than an accident.
India’s IITs and IISc produce genuinely world-class research in computer science, materials science, and engineering. The problem is not the quality of the research; it is the weakness of the commercialisation pathway. The university industry linkage in India remains thin by international standards: tech transfer offices are underfunded, patent licensing pipelines are immature, and the cultural norm of faculty entrepreneurship which is the engine behind MIT, Stanford, and CMU spinouts is still developing. The result is that India’s best research institutions and its most dynamic startup ecosystem run largely in parallel, occasionally intersecting, rarely forming the tight feedback loop that characterises innovation systems at the frontier.
What China, South Korea, and Israel Chose
and Why the Choice Mattered
In 2000, China’s R&D intensity was approximately 0.9 percent of GDP roughly where India is now, and not dramatically higher. What followed was one of the most deliberate transformations of a national innovation system in economic history. Successive five year plans progressively raised R&D targets, tied industrial policy to technology development in specific strategic sectors, and made the implicit bargain explicit: foreign firms could access the Chinese market in exchange for technology transfer. The Made in China 2025 plan contentious in its international implications, formidably effective in its domestic ones was the culmination of two decades of policy that treated research intensity as a strategic objective rather than a byproduct of growth. By 2023, China’s GERD to GDP ratio had reached 2.43 percent. Over roughly the same period, it has become the world’s largest manufacturer of solar panels, the leading producer of electric vehicles, and a serious competitor in semiconductor design.
South Korea’s trajectory is different in its mechanism but similar in its outcome. Korean research intensity approximately 4.9 percent of GDP, among the highest in the world was not built through state diktat but through competitive pressure on a particular kind of firm. The chaebols Samsung, LG, Hyundai, SK competed in global markets for consumer electronics, semiconductors, and automobiles. Competing at the frontier of those industries requires continuous research investment, because the technology itself is moving. Samsung spent approximately $21 billion on R&D in 2023 roughly equivalent to the entirety of India’s national GERD that year. When a company is competing for the leading position in NAND flash memory or OLED display technology, research is not optional; it is the cost of staying in the game.
Israel is the most extreme case and the most instructive. A country of nine million people now spends approximately 5.6 percent of GDP on research a figure that, per capita, dwarfs every other economy in the world. The architecture behind this is distinctive. Israel’s military technology apparatus particularly the IDF’s elite intelligence and technology units, Unit 8200 and Talpiot has functioned for decades as an involuntary, state-funded research and development programme. Engineers who spend three to five years solving genuinely hard problems in signals intelligence, cryptography, and autonomous systems graduate from military service with technical skills and a network that no commercial accelerator programme can replicate. They then start companies: Check Point, CyberArk, Mobileye, and dozens of others that have become global technology leaders trace a direct line back to military R&D pipelines. Fraunhofer Institutes in Germany offer an analogue in the civilian domain sixty-plus applied research organisations embedded in industrial clusters, bridging university science and corporate product development, funded by a hybrid of federal money and industry contracts. India has no equivalent institution operating at comparable scale.
What separates these ecosystems from India’s is not talent India’s engineering graduates are competitive with any in the world. The difference is in what happens before the startup. In ecosystems that produce frontier deep-tech companies at scale, there is typically a sustained period of publicly funded, technically demanding, commercially agnostic research in military laboratories, in university departments, in national research organisations that generates the foundational knowledge from which commercial technology eventually emerges. DARPA’s investment in packet switching, which eventually became the internet. Bell Labs’ transistor research, which eventually became the semiconductor industry. Weizmann Institute’s agricultural research, which seeded Israel’s precision agriculture sector. These were not startup programmes. They were science programmes, with the patience that science requires.
Export Sophistication, Productivity, and
the Long-Run Cost of Borrowing Other People’s Technology
Innovation intensity shapes an economy’s export basket in ways that have durable consequences for growth. The Hausmann-Hidalgo economic complexity framework which ranks products by the sophistication of the knowledge required to produce them finds a consistent empirical relationship between a country’s research intensity and the complexity of what it exports. Economies that invest heavily in research tend to move up the value chain: from assembly to components to advanced manufacturing to proprietary systems. Economies that remain technology adopters tend to remain trapped in lower complexity exports, captured in recurring price competition with other adopters.
India’s export basket tells a nuanced story here. The pharmaceutical generics industry which does conduct real process research has produced an export capability that is genuine and globally important; India supplies approximately 20 percent of global generic medicines by volume. IT services exports have reached $250 billion annually, reflecting an extraordinary build-up of human capital. But both of these export categories are, in the Hausmann-Hidalgo framework, positioned below the highest levels of technological sophistication: generics compete primarily on cost, and IT services compete on talent arbitrage rather than proprietary product ownership. The highest value technology exports globally advanced semiconductors, precision medical devices, defence electronics, enterprise software platforms come disproportionately from economies with high research intensity, because those products require foundational knowledge that only sustained investment in research generates.
Paul Romer’s endogenous growth models, and the empirical literature that followed, established that knowledge has a different economic character from physical capital: it is non-rival (one person’s use does not reduce another’s) and, under the right institutional conditions, generates increasing rather than diminishing returns over time. The formal implication is that an economy’s long-run growth rate is bounded by its investment in knowledge creation:
g_A = growth rate of the knowledge frontier
H_A = researchers actively expanding knowledge
δ = research productivity · φ = spillover parameter
The middle-income trap the tendency for countries to stall at roughly $6,000–10,000 per capita income is in large part a story about this ceiling becoming binding. Catch-up growth, powered by technology adoption and structural reallocation, can carry an economy to that level. Sustaining growth beyond it requires generating new frontier knowledge, which requires the research infrastructure that most middle-income trap economies have underinvested in. India’s per-capita income is still well below the trap threshold. But the policies that determine whether India crosses it successfully need to be established long before the threshold is reached, because research institutions and private sector R&D cultures take fifteen to twenty years to build.
Filing More Patents Is Not the Same
as Advancing the Frontier
India now ranks sixth globally in patent applications a dramatic improvement from its historical position, and a marker of real intellectual property activity. Between 2015 and 2023, annual filings at the Indian Patent Office grew from roughly 42,000 to over 90,000. The patent to GDP ratio improved meaningfully over the same period. These are not trivial developments.
Patents are a proxy for innovative activity, not a direct measure of it. The most economically consequential patents those underpinning a platform semiconductor architecture, a novel class of biologics, or a foundational encryption protocol are extraordinarily concentrated in a small number of institutions. TSMC, Intel, Qualcomm, and ASML together own the patent portfolios that determine the cost structure and capability ceiling of the entire global electronics industry. No Indian company is in that class. Pharma’s generics research, however real, does not produce patent portfolios of that strategic depth. The question for India is not whether it files enough patents it is whether any of those patents contain the kind of foundational knowledge that allows the country to capture value from, rather than merely use, the next wave of technological infrastructure.
262 per Million
India’s researcher density. The gap between this number and South Korea’s 8,714, or Israel’s 8,342, is not a difference of degree it is a difference of economic character. A knowledge economy requires a critical mass of people whose full-time professional role is expanding the frontier. 262 per million is not a foundation for that economy; it is a foundation for a very different one.
The researcher density figure exposes something that startup counts and GII rankings obscure. Research is not a distributed activity in the way that software development is. It requires specific institutional environments well-equipped laboratories, critical masses of experts, long tenure horizons that allow researchers to develop genuine depth, and a funding culture that tolerates years of negative results. India has a handful of world-class research institutions that provide these conditions for a small elite. Outside those institutions, the research infrastructure is thin. The result is that most of the talent that might have become researchers either enters the IT services industry, emigrates to the United States or Europe for graduate school and stays, or pivots into the startup ecosystem.
The diaspora dimension is not a simple loss. Indian-origin researchers at Stanford, MIT, and Caltech are publishing frontier science and occasionally spinning out companies. Some of that knowledge eventually flows back through the Global Capability Centre channel or through returning founders. But the balance of the flow remains outward. The United States captures the research output of India’s best trained scientists through a combination of institutional quality, funding depth, and a career structure that rewards scientific ambition more generously than India’s academic system currently does. Reversing this requires not just higher salaries but a research culture, and research cultures take longer to build than startup ecosystems.
Policy’s Reach, and Its Limits
India has not been passive. The Anusandhan National Research Foundation, established under the ANRF Act of 2023 with a proposed corpus of ₹50,000 crore over five years, represents the most significant institutional commitment to research funding reform in a generation. The IndiaAI Mission, with its investment in computing infrastructure and AI research, reflects a genuine awareness of the strategic stakes in frontier technology. The PLI scheme’s fourteen sector sweep has catalysed manufacturing investment at a scale that might, over time, generate private sector R&D demand. The government’s Fund of Funds for Startups has crowded in private capital at the early-stage end of the market.
These commitments exist alongside a structural tension that policy has not yet resolved. India eliminated the 200 percent weighted deduction for corporate R&D expenditure in 2016, as part of a broader simplification of the corporate tax structure. The rationale was coherent in isolation the deduction had not reliably generated additional research investment, and its removal simplified the tax code. The consequence, however, was to remove the primary fiscal signal that the government valued private sector research. South Korea, by contrast, has maintained and deepened its R&D tax credit system for decades; so has Taiwan, which used a combination of credits, research park infrastructure, and technology transfer support to build TSMC’s ecosystem. These are not coincidentally the economies with the highest private sector R&D intensities in the world.
The GCC ecosystem offers a different kind of policy lever. India now hosts more than 1,700 Global Capability Centres facilities established by multinational corporations for deep technical work, including research and product development, rather than just back office operations. The newer cohort of GCCs is doing genuine R&D: AI research, semiconductor design validation, advanced analytics for drug discovery. If India can create the institutional and fiscal conditions to deepen this work to shift GCCs from implementation to genuine research it would represent a form of embedded private sector research investment that the formal GERD statistics undercount. The challenge is that GCC research is ultimately owned by the parent company, which limits the knowledge spillovers that make research economically distinctive at the national level.
India’s low R&D intensity is not primarily a policy failure. It is the outcome of a rational market equilibrium in an economy structurally optimised for low-capital, fast scaling, software driven business models. The incentives for entrepreneurs, for venture capitalists, and for large corporations each independently point away from research investment and toward application, distribution, and service delivery. Changing the aggregate requires changing the competitive incentives that make this equilibrium rational which means creating industries where frontier research is the cost of market participation, not an optional premium.
The Hidden Cost of Borrowing
Other Countries’ Technology
There is a dimension of the research intensity question that economic statistics miss almost entirely: technology dependency as a form of strategic vulnerability. An economy that does not generate its own frontier technology must import it in the form of capital goods, licensed intellectual property, software subscriptions, and component purchases. The cost of this is partly financial: technology royalties and component imports represent a persistent outflow of value. But the deeper cost is structural: an economy that depends on imported technology is dependent on the decisions of foreign governments and corporations about what to make available, at what price, and on what terms.
The US export controls on advanced semiconductors to China, tightened progressively since 2022, made this vulnerability visible in its most acute form. China’s response a multi hundred billion dollar programme to develop domestic semiconductor manufacturing capability was the response of an economy that had already identified technology dependency as a strategic risk and had been investing in reducing it for years. India has analogous vulnerabilities: its dependence on imported semiconductor chips, on foreign controlled cloud infrastructure, on GPS systems it does not control, and on a pharmaceutical supply chain that relies on Chinese API imports for roughly 70 percent of its inputs, according to industry estimates. These dependencies are manageable in normal times. They become structural risks when geopolitical conditions change and geopolitical conditions are, by most measures, changing.
The economies that have best managed this risk Israel in defence electronics, South Korea in memory semiconductors, Taiwan in foundry technology did so by building research capability in the specific domains where dependency was strategically unacceptable. This was not a market outcome. It was a deliberate choice to accept the cost and patience of deep research investment in strategic sectors, with the horizon measured in decades rather than quarterly cycles. India has begun to identify the relevant sectors semiconductors, space, advanced materials, quantum through its industrial policies. Whether the institutions to support those identifications are being built at commensurate speed is a more open question.
Building the Science That the Startups Will Eventually Need
There is a version of India’s innovation story in which everything is fine. The startup ecosystem is growing. The GII rank is rising. Patent filings are up. The GCC sector is deepening. GDP is expanding at rates that most major economies would envy. In this version, the R&D intensity number is a lagging indicator that will eventually catch up, and the people who worry about it are mistaking a process for a problem.
There is another version in which the startup economy and the research economy are not the same thing, do not necessarily lead to each other, and can diverge for long enough that the divergence itself becomes structural. In this version, an economy can produce a great many impressive companies, a great many impressive valuations, and a great many LinkedIn announcements while quietly becoming more dependent on the technological decisions of other countries, more concentrated in sectors where the underlying value is created elsewhere, and less capable of the kind of frontier knowledge generation that sustains competitive advantage at high income levels. The middle-income trap is populated with countries that confused the first version for the truth.
The data does not tell us which version India is in. It does tell us that the research intensity the one variable that most strongly predicts which trajectory an economy is on has not moved in twenty years. The startup count has grown by a factor of 250 since 2015. The GERD ratio has declined slightly. These two facts together describe something more specific than an innovation gap. They describe an innovation ecosystem that has been, with considerable skill and energy, optimised for exactly the activities that low research intensity makes rational. Changing that optimisation is a longer and harder project than building the next 100,000 startups.
“India has built an ecosystem for distributing technology. The harder question whether it is building the institutions to generate it has not yet been answered. The answer will take decades to reveal itself. The time when it matters most to ask the question is precisely now, when the urgency is not yet obvious and the options are still open.”
Department of Science and Technology, GoI. (2023). Research and Development Statistics at a Glance 2022–23. NSTMIS, DST.
Ministry of Science and Technology, GoI. (2024). Parliamentary Q&A on R&D Investment in India. PIB. PRID 2153547.
WIPO. (2025). Global Innovation Index 2025. World Intellectual Property Organization.
UNESCO Institute for Statistics. (2024). R&D expenditure by sector of performance — cross-country database. databrowser.uis.unesco.org
OECD. (2023). Main Science and Technology Indicators (MSTI) 2023/2. OECD Publishing.
Deloitte India. (2024). Structural changes to incentivise the Research & Development sector in India. White Paper.
Economic Advisory Council to the PM (EAC-PM). (2019). Current Status & Way Forward: R&D Expenditure Ecosystem. Government of India.
NASSCOM. (2023). Indian Startup Ecosystem Report 2023.
Tracxn. (2024). India Tech Startup Landscape Report.
Hausmann, R., Hidalgo, C. et al. (2011). The Atlas of Economic Complexity. MIT Press.
Romer, P. (1990). Endogenous Technological Change. Journal of Political Economy, 98(5), S71–S102.
World Bank. Research and development expenditure (% of GDP). World Bank Open Data.
DPIIT. (2024). Startup India Dashboard: Recognised Startup Statistics. Government of India.
Indian Patent Office. Annual Reports (2015–2023). CGPDTM, Government of India.
NASSCom. (2024). GCC Landscape India: 2024 Annual Report.
Leave a Reply